
An original Plumbing By The Book data study · by Thomas Kwayne · June 2026 · free to cite with attribution (CC BY 4.0)
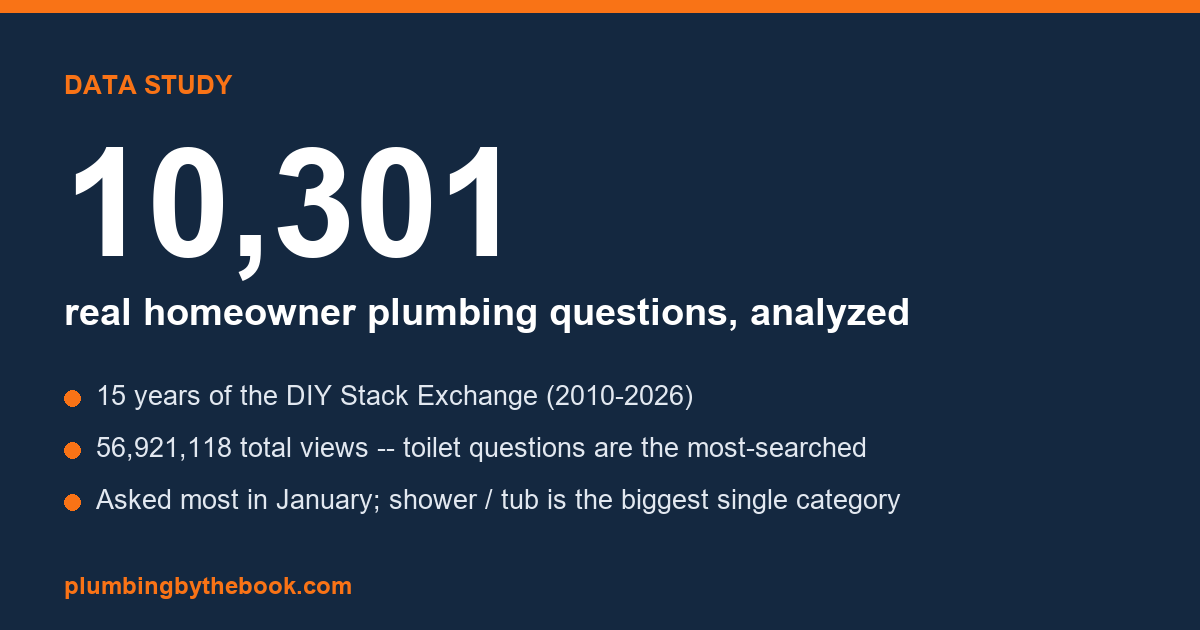
Which plumbing problems do homeowners actually run into most? Not opinion — data. We analyzed 10,301 real homeowner plumbing questions spanning 16 years (2010–2026): a near-complete population of the public DIY Stack Exchange plumbing tag, with 56,921,118 cumulative views between them. This is the definitive, full-population successor to our earlier 227-question read.
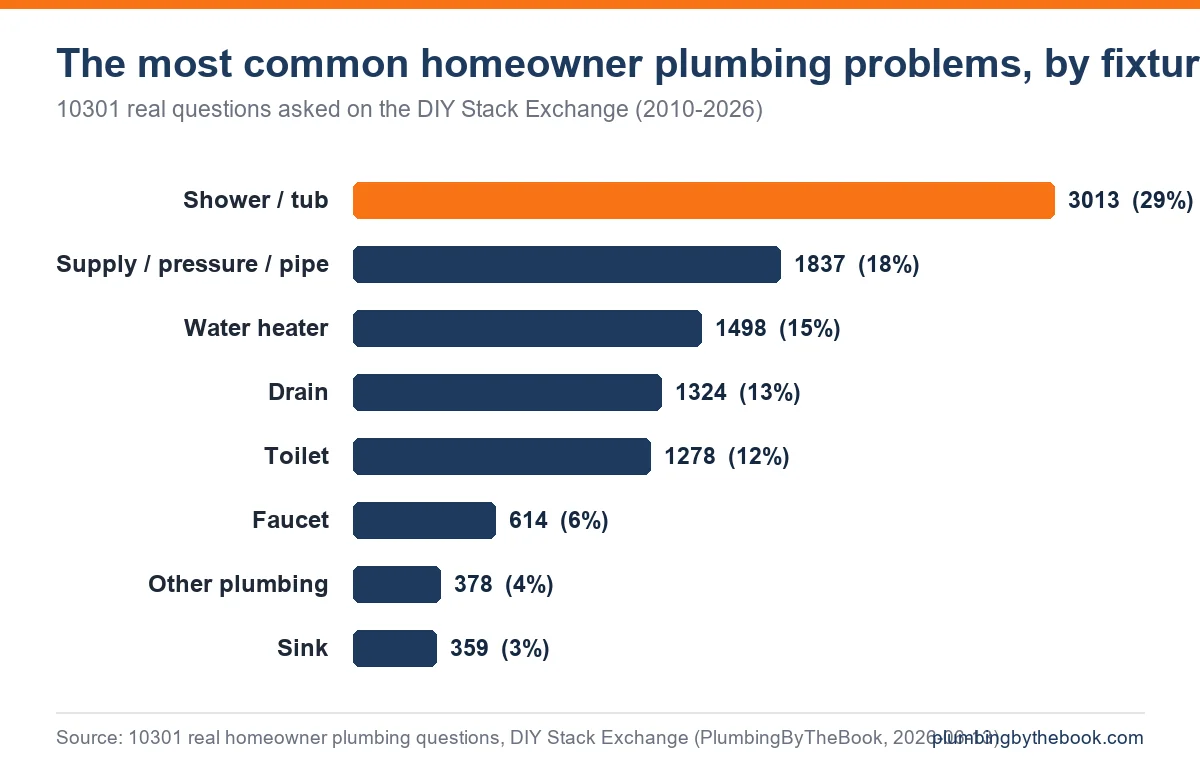
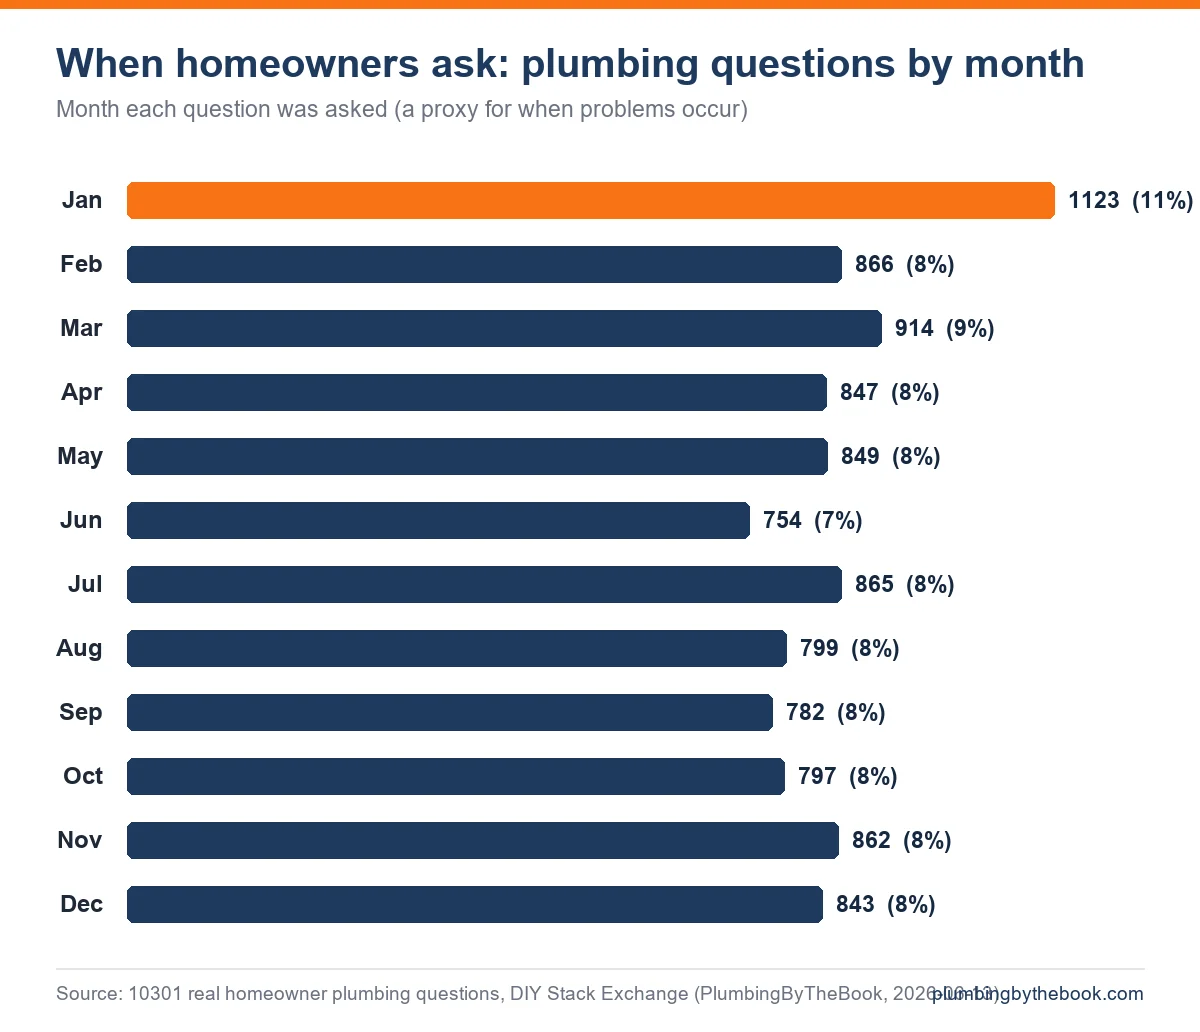
Shower/tub valves are the single most-asked-about fixture (29.2% of 10,301 questions) — but TOILET questions draw the most views per question (10,063 each), making toilets the most-read plumbing topic of all. Plumbing questions peak in Winter (Dec-Feb) (busiest month: January); Summer (Jun-Aug) is the quietest season.
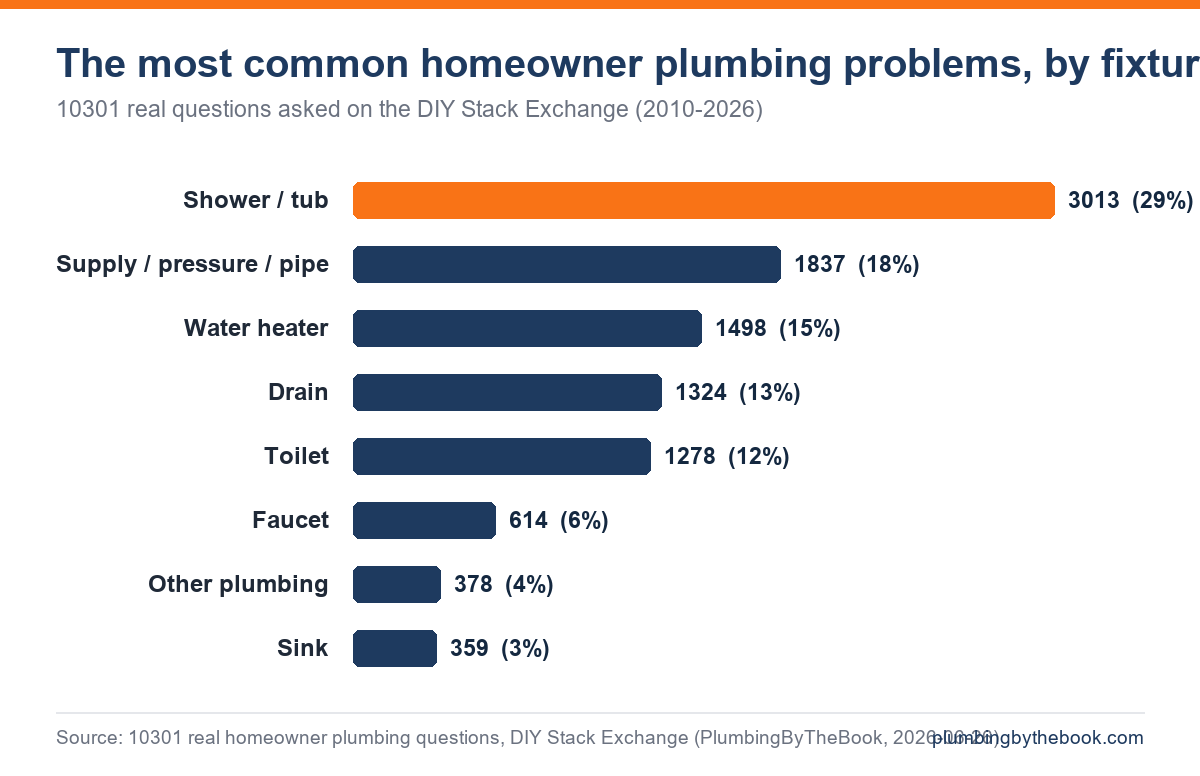
What homeowners ask about most (by fixture)
Every question is classified by its OWN Stack Exchange tags first (a question tagged toilet IS a toilet problem — no keyword guessing), with title keywords as the fallback. The shower/tub valve leads, followed by supply/pressure/pipe problems and water heaters:
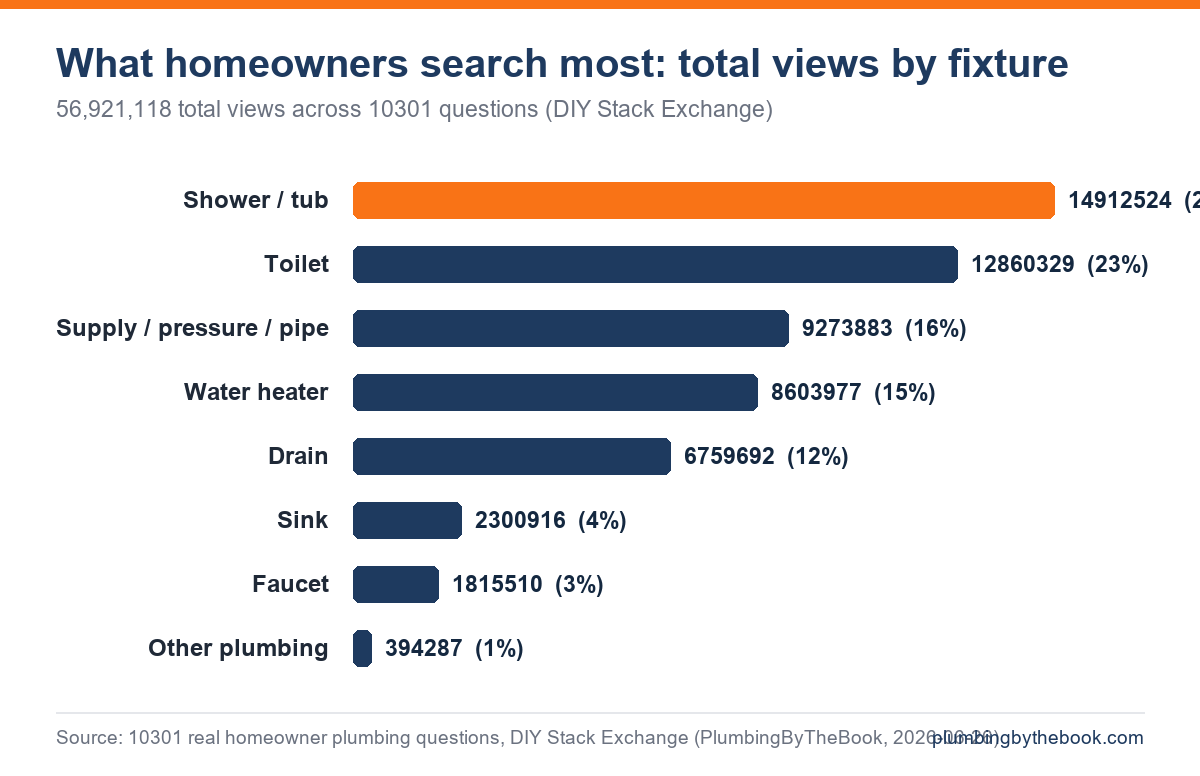
What gets READ most is different from what gets ASKED most
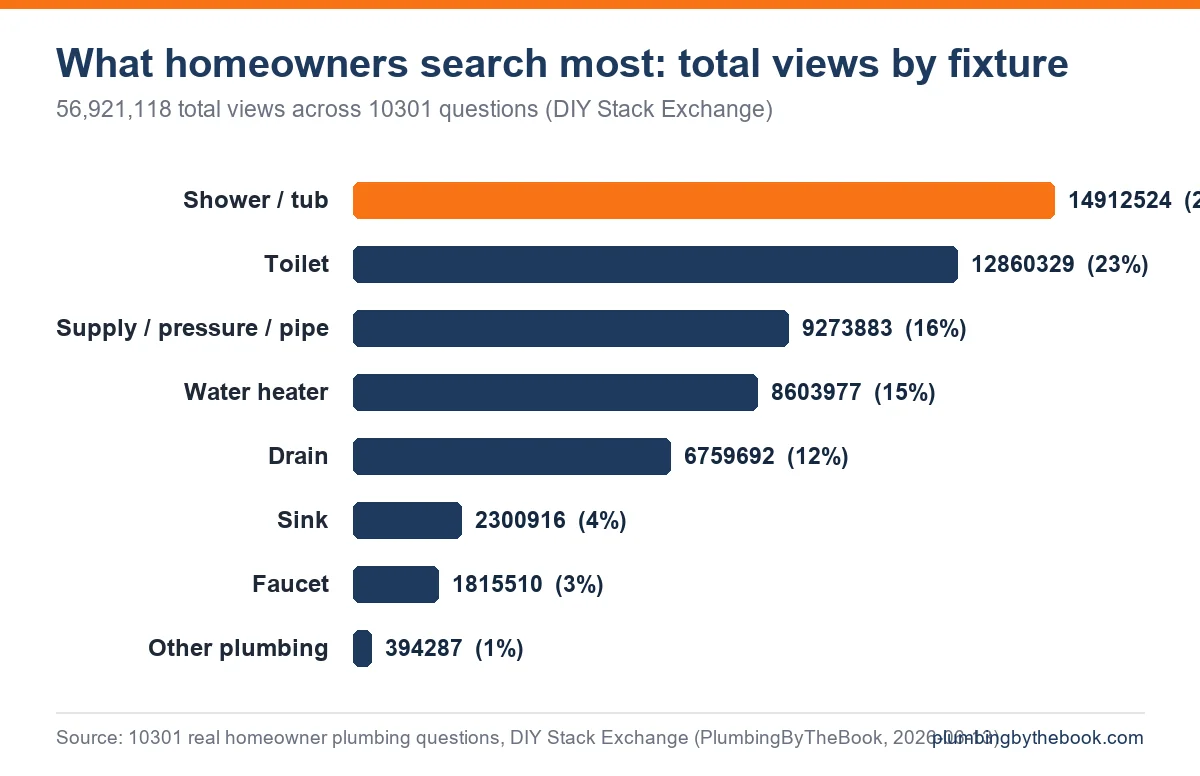
Question COUNT is demand; VIEW count is interest. They diverge: toilets are only the 5th most-asked fixture but the #1 most-VIEWED per question (10,063 views each) — a running or leaking toilet is the problem the most people come looking to solve. Across all 56,921,118 total views, shower/tub and toilet content dominate readership.
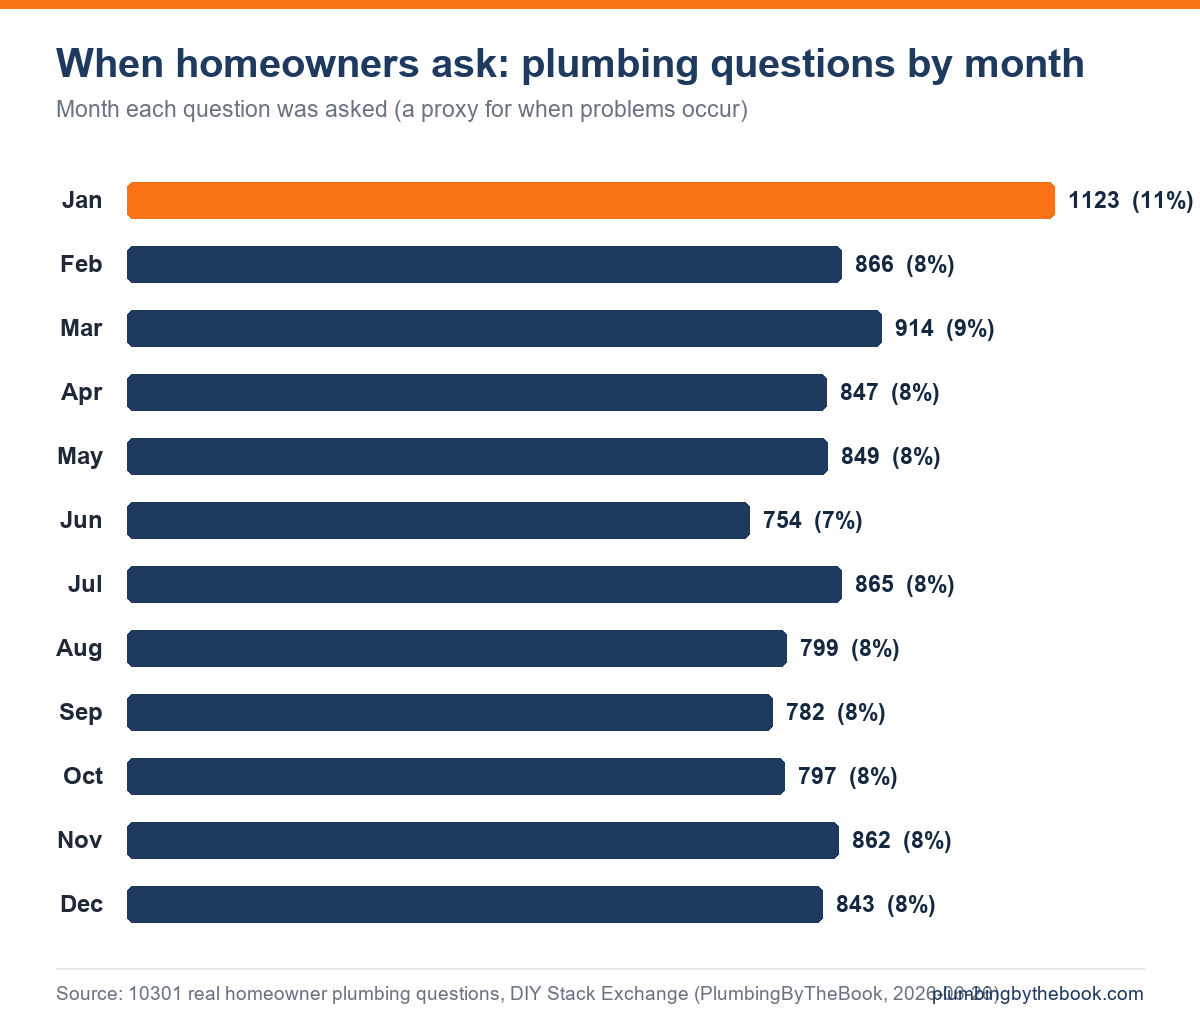
When plumbing problems peak (15-year seasonality)
Aggregating the ask-month across all 15 years, plumbing questions show a modest winter peak — Winter (Dec-Feb) (2,832 questions) edges out the rest, with January the single busiest month, consistent with cold-weather pipe and water-heater problems. The effect is real but moderate: plumbing breaks year-round.
The full fixture table (every number is reproducible)
Counts, share, and cumulative public views per fixture — run scripts/data_study_plumbing_at_scale.py over the corpus to reproduce every figure:
| Fixture | Questions | Share | Cumulative views |
|---|---|---|---|
| Shower / tub | 3,013 | 29.2% | 14,912,524 |
| Supply / pressure / pipe | 1,837 | 17.8% | 9,273,883 |
| Water heater | 1,498 | 14.5% | 8,603,977 |
| Drain | 1,324 | 12.9% | 6,759,692 |
| Toilet | 1,278 | 12.4% | 12,860,329 |
| Faucet | 614 | 6.0% | 1,815,510 |
| Other plumbing | 378 | 3.7% | 394,287 |
| Sink | 359 | 3.5% | 2,300,916 |
Why this matters (and how to use it)
The most common, most-read problems — shower/tub cartridges, toilets, drains, faucets — are also the ones most worth learning to fix. The #1 thing that stops a DIY repair is identifying the right part, which is why we built a free Cartridge & Valve Finder, a Repair Cost Estimator, and step-by-step guides for toilets, showers, faucets, and drains. For which of these is genuinely worth your time, see our DIY-value study.
Methodology & honesty notes
Source & sample: 10,301 unique questions from the public DIY/Home Improvement Stack Exchange under the plumbing tag and its sub-tags (toilet, faucet, shower, drainage, water-pressure, water-heater, sink, bathtub, sump-pump, pipe), asked 2010 to 2026. This is a near-complete POPULATION of that site’s plumbing questions, not a survey sample. 80% have an accepted or scored answer.
Classification: each question’s own tags are the primary fixture classifier (transparent, no guessing); the title is the fallback and the symptom classifier. The largest symptom bucket is “general / unclear” because many real questions do not state a symptom in the title — we report that honestly rather than force a guess.
Seasonality is the month a question was ASKED — a proxy for when the problem occurred or was searched, stated as such, not the date of the actual failure. Views are Stack Exchange’s public CUMULATIVE counts since posting, so older questions have had more time to accumulate views; we therefore use views-per-question as a RELATIVE engagement signal, not absolute demand, and disclose the age bias.
The 15-year trend: question volume grew to a peak around 2023 (1,370 questions/year); the most recent years (2025-2026) are lower partly because they are incomplete at collection time and partly a broader shift of Q&A to other channels — so the recent tail is not directly comparable, and we do not read a decline into it.
Audience: public DIY Q&A skews toward homeowners attempting the fix themselves — exactly the relevant population for “what do DIYers run into,” but not all plumbing problems (a pro-only emergency rarely becomes a forum question).
License: free to cite and reuse with attribution to Plumbing By The Book (CC BY 4.0). Suggested citation: Kwayne, Thomas. “Most Common Plumbing Problems: What 10,301 Real Homeowner Questions Over 15 Years Reveal.” Plumbing By The Book, 2026. https://plumbingbythebook.com/most-common-plumbing-problems-data-study/
Key findings (free to cite with a link)
Cite this study
Free to cite with a link to plumbingbythebook.com. Three ready formats:
Plain text
HTML
APA
Embed a chart (free, please keep the credit)
For journalists
Author: Thomas Kwayne, editorial voice of Plumbing by the Book -- researched, spec-checked DIY guidance (not a licensed plumber). Guides + studies are researched and drafted with AI tools and checked against manufacturer specifications and published standards.
Method: Observational analysis of 10,301 real homeowner plumbing questions from the DIY Stack Exchange (2010-2026), collected via the public Stack Exchange API and deduplicated by question ID. Primary fixture is taken from each question's own tags. Aggregate counts only; Stack Exchange content is CC BY-SA. Not a representative survey.
Charts and stats are free to use with a link to https://plumbingbythebook.com/most-common-plumbing-problems-data-study/. Questions / the underlying classification rules: via the contact page.