
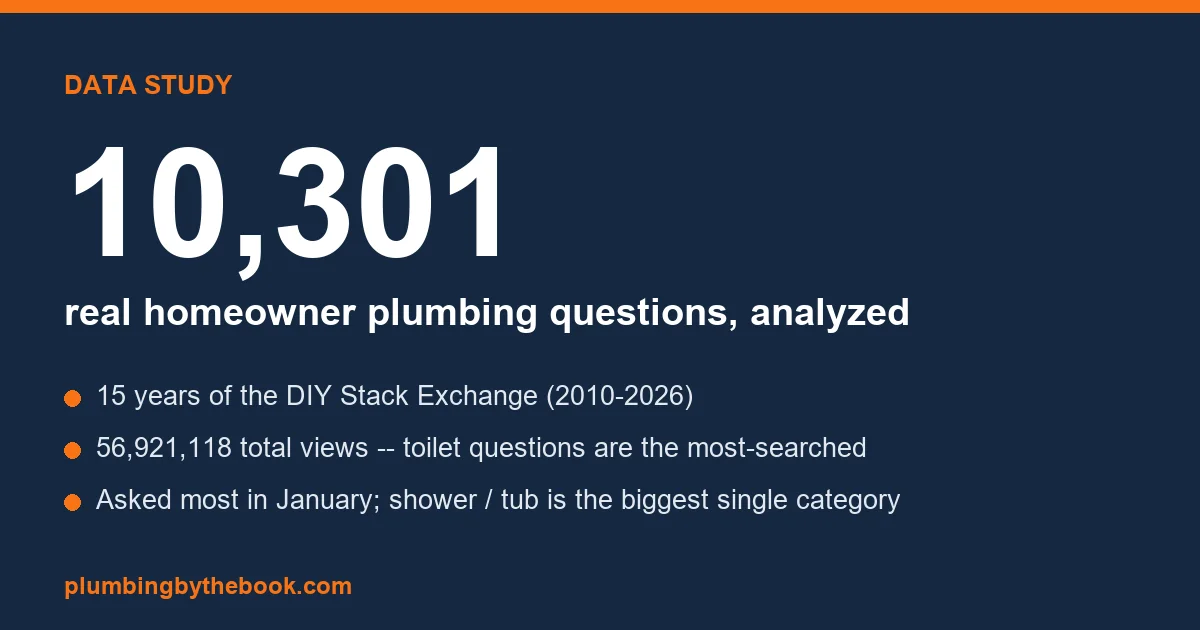
What do homeowners actually struggle with when a pipe, fixture, or drain goes wrong? Not what a brand’s marketing says, and not a survey of a few hundred people – the real, unfiltered record of what people ask when something breaks. So we went to the largest public archive of it we could honestly assemble: every plumbing question we could pull from the DIY Stack Exchange, the long-running community where homeowners post real repair problems and get them answered.
The result is 10,301 real homeowner plumbing questions spanning 2010 to 2026 – collectively viewed 56,921,118 times. This is our biggest data study yet (our earlier study used 227 questions), and the scale changes what it can tell us. Here is what 15 years of real homeowner plumbing problems reveal.
Shower and tub problems are the single biggest category
Sorted into one primary fixture each, the 10,301 questions break down like this:
- Shower / tub: 3,013 (29%) – the largest single category. Diverters, cartridges, low flow, leaks behind the wall.
- Supply / pressure / pipe: 1,837 (18%) – pipes, fittings, shut-offs, water pressure, sump pumps.
- Water heater: 1,498 (15%) – no hot water, not enough hot water, tankless faults.
- Drain: 1,324 (13%) – clogs, slow drains, sewer smells, garbage disposals.
- Toilet: 1,278 (12%) – running toilets, flappers, fill valves, leaks.
- Faucet: 614 (6%) – cartridges, aerators, drips, handles.
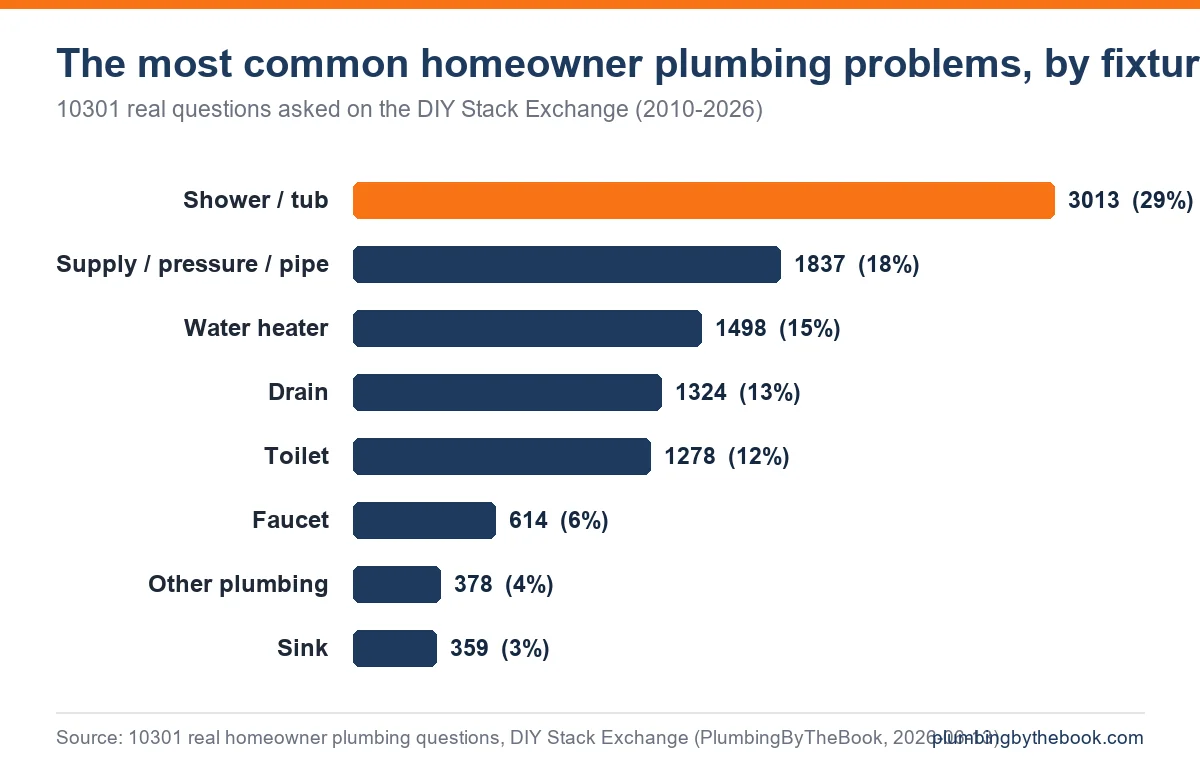
A note on reading this honestly (the full method is at the bottom): the corpus is built from questions carrying the plumbing tag plus the major fixture/system tags, so these counts reflect how many questions carry each fixture’s tag – a category’s size here is a measure of how much it is discussed, not a random census of every plumbing event in every home. Shower/tub leading is consistent across both the tag count and total views (below).
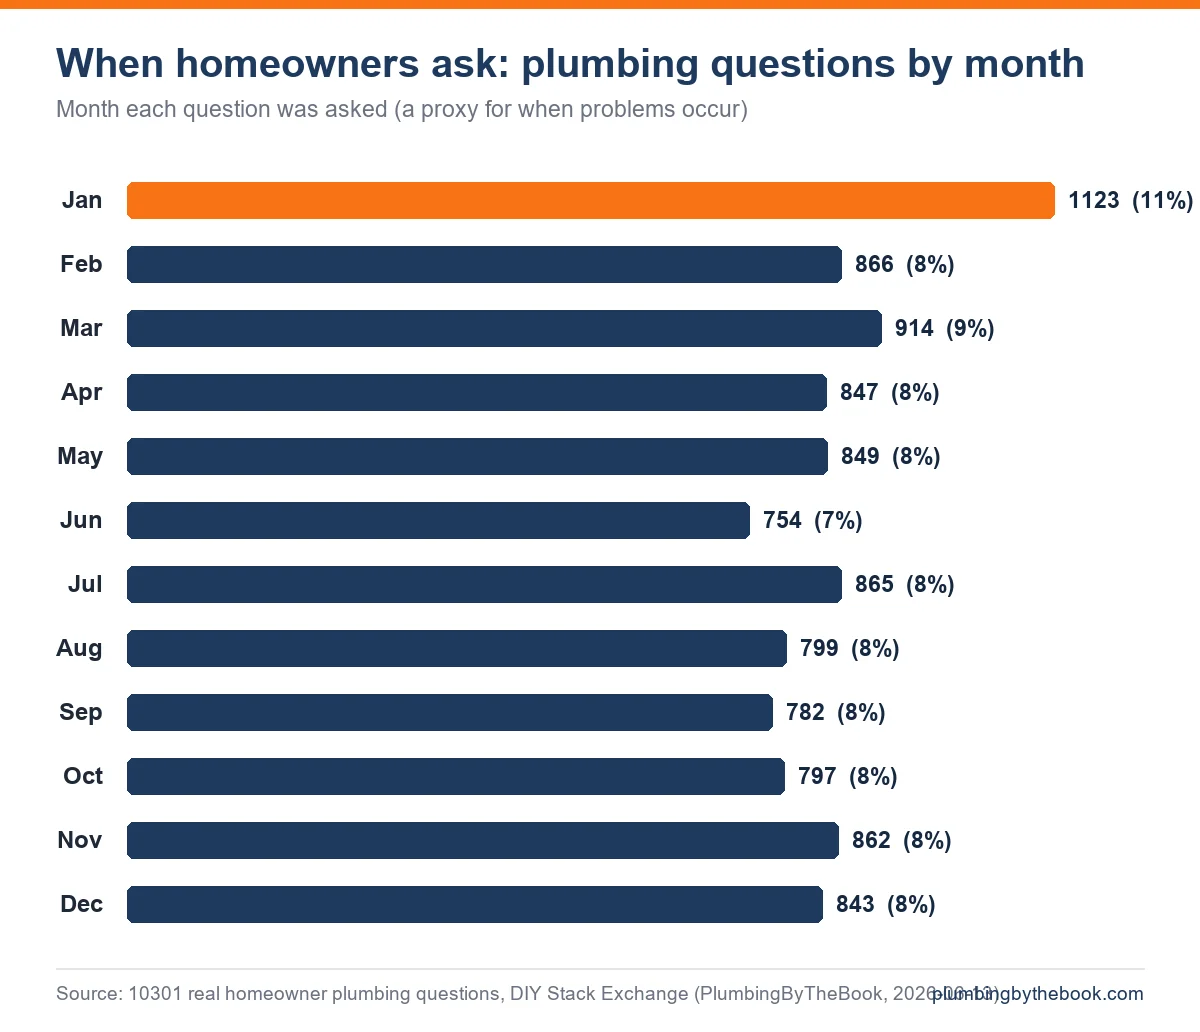
January is the busiest month for plumbing questions
Plumbing is often called a winter business – frozen pipes, holiday house-fulls, heating-season water heaters. The 10,301 questions, grouped by the month they were asked, show a real but modest seasonal effect, with one clear standout:
- January is the single busiest month: 1,123 questions (11%) – about 49% above the quietest month.
- June is the quietest: 754 (7%).
- Every other month sits within a tight 8-9% band.
So the popular image of plumbing as a deeply seasonal problem is only half right: questions are spread fairly evenly across the year, but there is a genuine January spike – the post-holiday, deep-cold, “we finally have time to deal with it” peak.
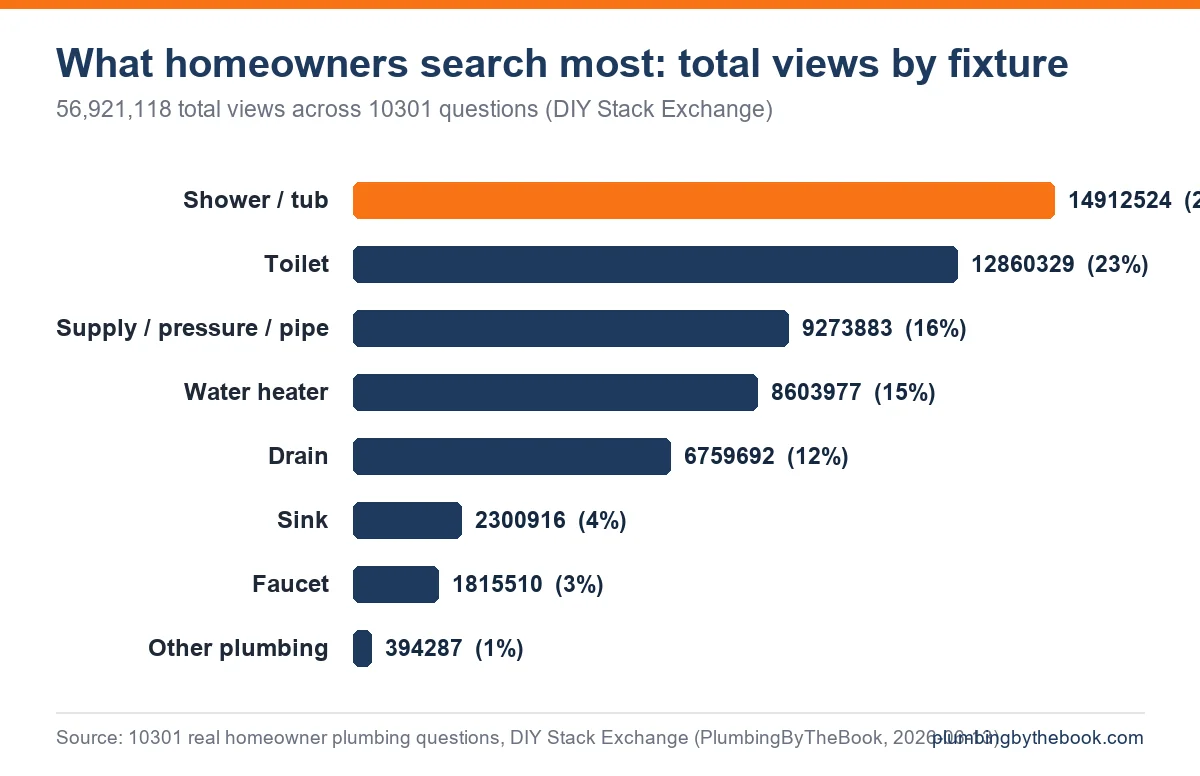
Toilets get searched the most – even though fewer people ask
The 10,301 questions have drawn nearly 57 million views between them. Splitting those views by fixture tells a different story than the question counts do:
- Shower / tub: 14.9M views and Toilet: 12.9M views lead, together pulling almost half of all attention.
- But per question, toilet problems are the most-viewed of any category – about 10,063 views each, well ahead of the next group (sink ~6,400, water heater ~5,700).
In other words: people ask about toilets a little less often, but a toilet question is the most universally relevant – when one person posts “why is my toilet running,” tens of thousands of others find it searching the same thing. The running toilet is the closest thing plumbing has to a universal problem.
Homeowners are DIY-first – at scale
The largest single intent we could classify was install / replace / how-to: 2,548 questions (25%) – people who already know roughly what is wrong and just want to do the repair themselves. That confirms, on a 10,301-question corpus, what our smaller intent study found: homeowners overwhelmingly want to fix it themselves. The wall they hit is usually a step earlier – figuring out which part their fixture takes. That is exactly the gap our free Cartridge & Valve Finder exists to close, and why a running-toilet owner can estimate the cost of the waste with our Toilet Water-Waste Calculator.
Method and limitations (so you can cite this with confidence)
- Source + N: 10,301 unique questions from the DIY Stack Exchange, collected 2026-06-13 via the public Stack Exchange API, deduplicated by question ID. Questions span 2010-07-21 to 2026-06-13. Stack Exchange user content is licensed CC BY-SA; this study reports only aggregate counts, never reproduces individual posts.
- How the corpus was built: we pulled questions tagged
plumbingplus the major fixture/system tags (toilet,faucet,shower,drainage,water-pressure,water-heater,sink,bathtub,sump-pump,pipe), then deduplicated. Limitation: Stack Exchange’s unauthenticated API caps a single tag at its most recent 2,500 questions, so theplumbingtag reflects its most recent 2,500 (the smaller fixture tags are captured in full). Category sizes therefore measure how much each topic is discussed/tagged, not a random census of all plumbing events. - Classification: each question’s primary fixture is taken from its own Stack Exchange tags (a question tagged
toiletis a toilet problem; multi-tag questions are counted once under their most specific fixture), with a title-keyword fallback. Symptom is classified from the title only; because titles are short and specific, a majority do not match a single symptom keyword and are left unclassified rather than force-fit – so we report intent (install/replace/how-to) where it is clean and do not over-claim a symptom ranking. - Seasonality is the month a question was asked, a reasonable proxy for when problems occur or are searched – not a measurement of failure dates.
- Audience caveat: Stack Exchange skews toward more technical DIYers; this is observational community data, not a representative survey of all U.S. homeowners.
- Reproducible: the collection and analysis are deterministic scripts (
collect_plumbing_qa_corpus.py,data_study_plumbing_at_scale.py); the same corpus in produces the same numbers and charts out.
This study extends our first plumbing-problems data study (N=227) and our intent study to a far larger, more authoritative sample. The headline holds across all three: homeowners are ready to do the work; the hard part is knowing what they are looking at.
Key findings (free to cite with a link)
Cite this study
Free to cite with a link to plumbingbythebook.com. Three ready formats:
Plain text
HTML
APA
Embed a chart (free, please keep the credit)
For journalists
Author: Thomas Kwayne, editorial voice of Plumbing by the Book -- researched, spec-checked DIY guidance (not a licensed plumber). Guides + studies are researched and drafted with AI tools and checked against manufacturer specifications and published standards.
Method: Observational analysis of 10,301 real homeowner plumbing questions from the DIY Stack Exchange (2010-2026), collected via the public Stack Exchange API and deduplicated by question ID. Primary fixture is taken from each question's own tags. Aggregate counts only; Stack Exchange content is CC BY-SA. Not a representative survey.
Charts and stats are free to use with a link to https://plumbingbythebook.com/most-common-plumbing-problems-data-study/. Questions / the underlying classification rules: via the contact page.
Related guides

What Homeowners Really Want When Plumbing Breaks: A Search-Intent Study of 227 Questions [2026]
When a plumbing fixture fails, conventional wisdom says the homeowner’s problem is the repair itself. The data says…
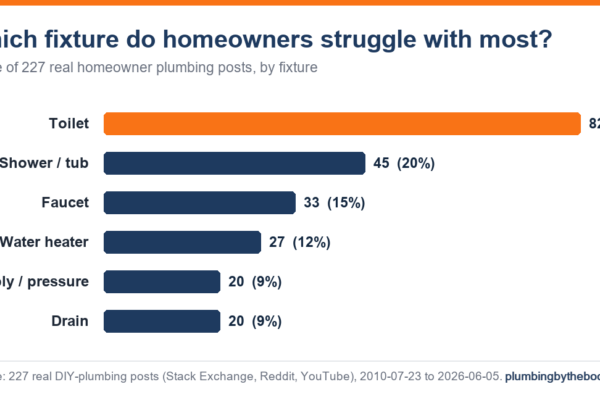
Most Common DIY Plumbing Problems, Ranked: What 227 Real Homeowner Questions Show [2026]
An analysis of 227 real homeowner plumbing posts: toilets are the #1 problem (36%), leaks the most common…